


Editor’s note: The first in a series on topics relating to race equity issues in Iowa, with a focus on Cedar Rapids.
A visit to the African American Museum brings a unique opportunity to explore one of the deeply rooted sources of racial inequality seen in several Iowa communities in its current exhibit, Mapping Exclusion – Redlining in Iowa. The exhibit showcases seven Iowa cities in which Black populations were subject to redline mapping: Cedar Rapids, Council Bluffs, Sioux City, Dubuque, Davenport, Des Moines and Waterloo.
Redlining, as defined by Merriam-Webster, is the illegal practice of refusing to offer credit or insurance in a particular community on a discriminatory basis (such as because of the race or ethnicity of its residents). This can be seen in systematic denial of financial services such as mortgages, insurance and loans based on location (and the location’s associated default history) rather than on an individual applicant’s qualifications and creditworthiness. It has also been seen influencing terms and approvals for student, business, car and personal loans.
In response to the housing crisis following the Great Depression, the US federal government established the National Housing Act of 1934. From this, the Home Owners’ Loan Corporation, in an attempt to stabilize the housing market, would grade neighborhoods and classify them into four categories: “Best,” “Still Desirable,” “Definitely Declining,” and “Hazardous.”
The name redlining was derived from the literal process of drawing lines around sections of communities on maps with the ones deemed “hazardous,” which most often correlated to neighborhoods with minority occupants and considered high-risk for loans, marked with the color red.
The exhibit showcases Iowa cities featured on an interactive online project called Mapping Inequality: Redlining in New Deal America, a collaboration between several academic institutions and teams, which can be accessed at dsl.richmond.edu/panorama/redlining. This site shows a map of communities across the nation, with accessible records, detailing the historical practices of redlining. The maps can be explored and the notes listing the reasons for the HOLC grade assessed.
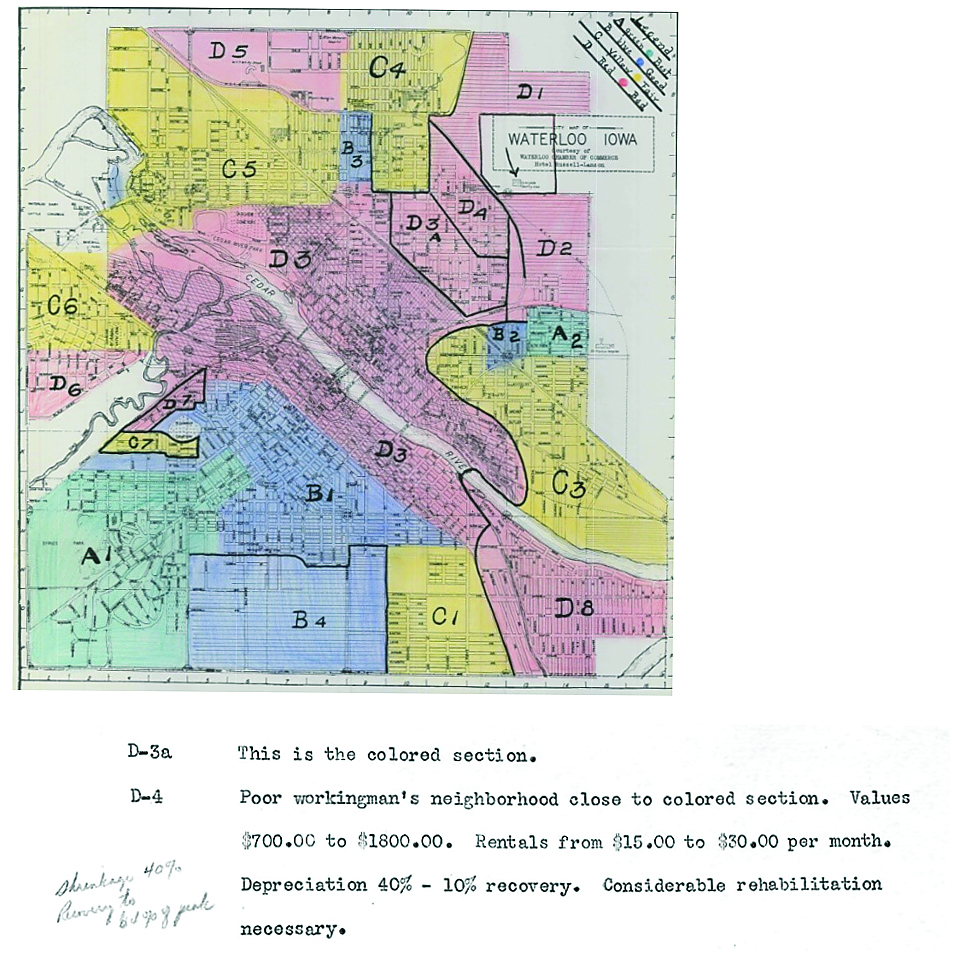
Upon exploring these notes, examples of race and/or ethnicity being the predominant characteristics leading to poor evaluations become obvious. For example, section D3A for Waterloo simply states, “This is the colored section,” and from section D4, “Poor workingman’s neighborhood close to colored section.” Other entries from cities in Iowa refer to “Poor white trash,” “Type of inhabitant consists mostly of the Italian race,” “This is known as one of the colored districts,” “It is a foreigner and negro section,” and “Laborers of the poor class live here,” in their descriptions.
Although the Fair Housing Act of 1968 made the practice of redlining illegal, the effects can persist through generations. Generational wealth is often linked to home ownership. Redlined neighborhood residents additionally have higher incidences of chronic health conditions, reduced life expectancy, less access to healthy and affordable food and reduced local retail outlets near residence, along with issues of displacement and gentrification. Homes of equal quality and age can differ in value up to 50 percent, depending in which area they are located – those historically inhabited by white or by black populations.
When considering the lasting effects of discriminatory practices such as redlining, one should consider how family history determines their fate in terms of accumulating wealth, commented Sarah Barfels, professor of sociology at Kirkwood Community College.
“For instance, if my father or grandfather was denied the ability to buy a home, I could not inherit it. They could not use it as a means of getting a school loan for me. They couldn’t downsize and gift me money for my own down payment,” shared Barfels.
“All of this contributes to the wealth gap between the average white and black family, which is eight to eleven times more wealth for the average white family, and, hence, the fact that in 2016 in Iowa, 75 percent of white families own homes compared to only 26 percent of African American families,” Barfels continued.
The Mapping Exclusion Redlining in Iowa exhibit is scheduled to close on Saturday, May 7. Check blackiowa.org or call the museum for current hours of operation. Many local libraries have Adventure Passes available for check out by adult library card holders (reservations can be accessed at http://www.eventkeeper.com/mars/tkflex.cfm?curOrg=GRIMES) and can be used for admission to the African American Museum.

Categories: Feature